Xelynx
registered on Xelynx
across 500+ locations
being served
Start working with Xelynx to manage your network better
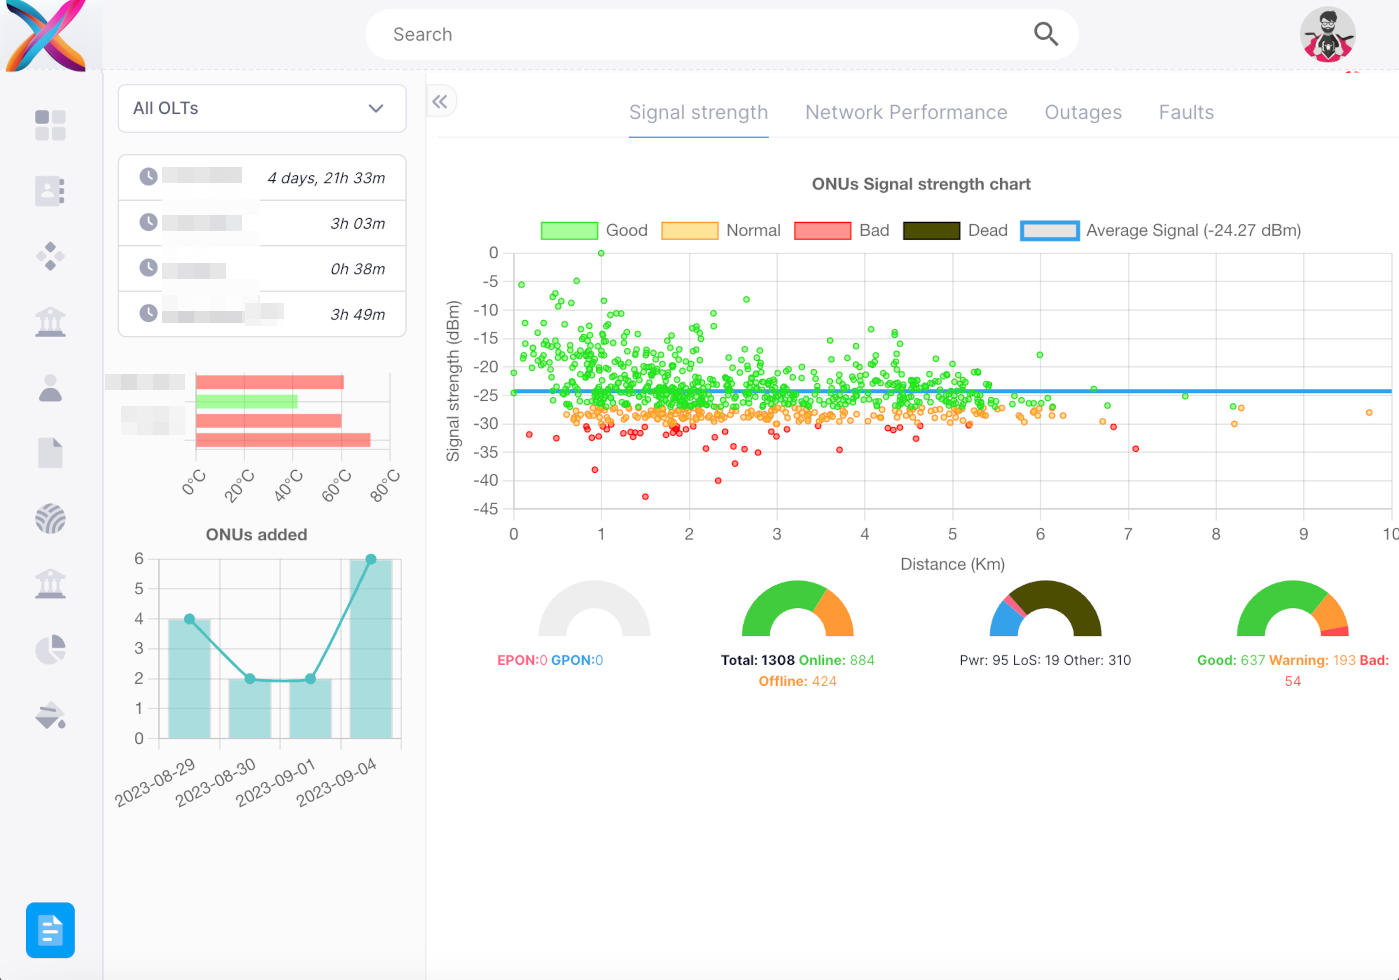
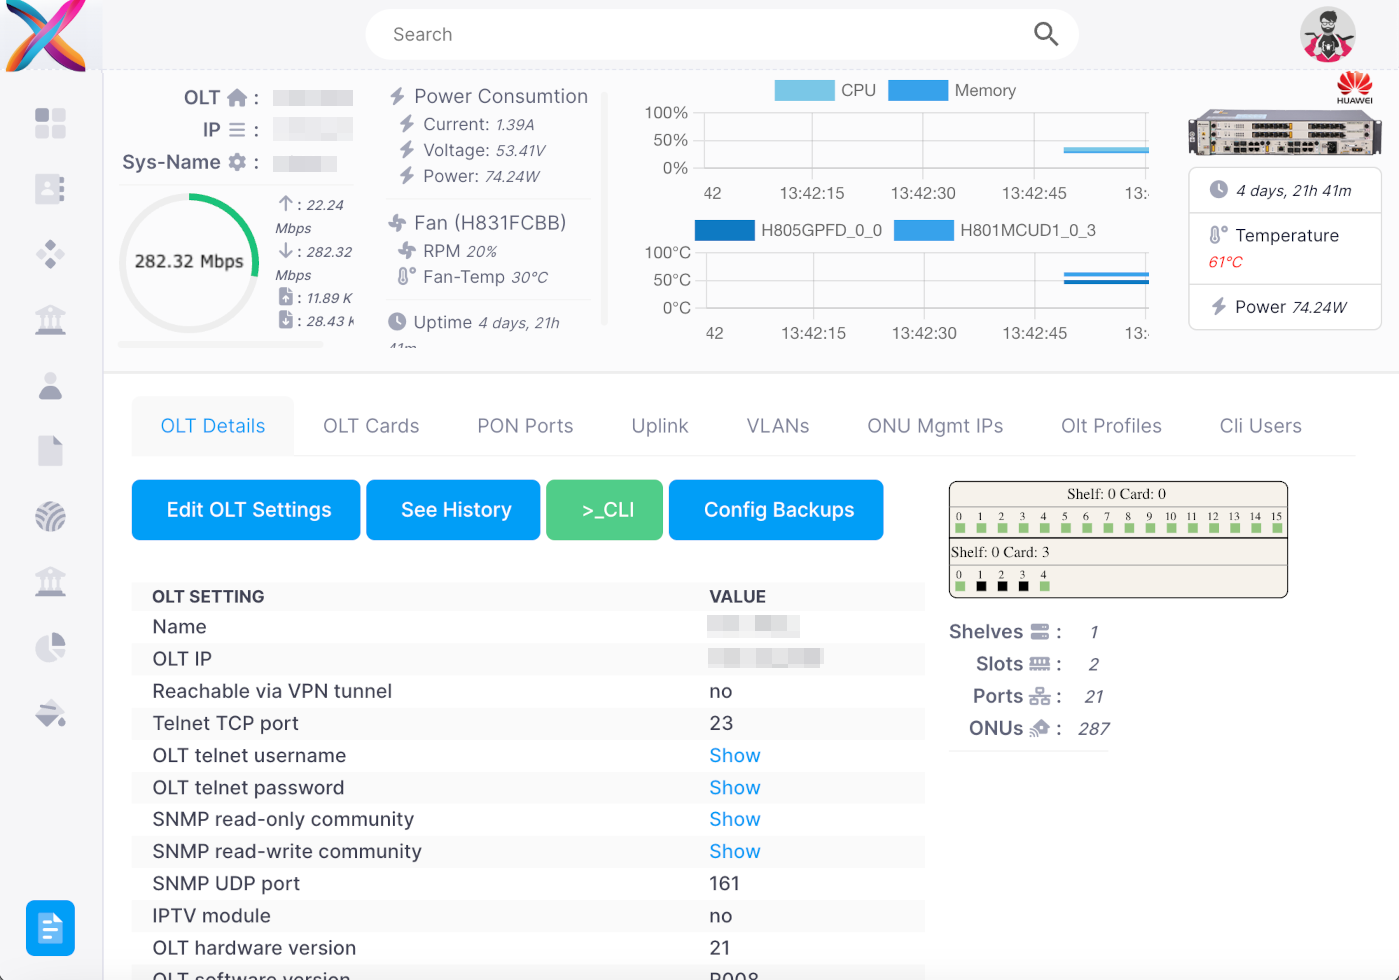
OLTs perform better when they are operating under optimum conditions. You can check OLTs temperature (highest of all cards installed) and their uptime from dashboard.
Monitoring individual ONTs/ONUs based on their online status, distance, signal has been made easy by showing the statistics of live data on dashboard. Monitoring the CPEs was never this easy.
Knowing your network expansion is very important so that you can prepare and adjust other variables to enable that expansion.
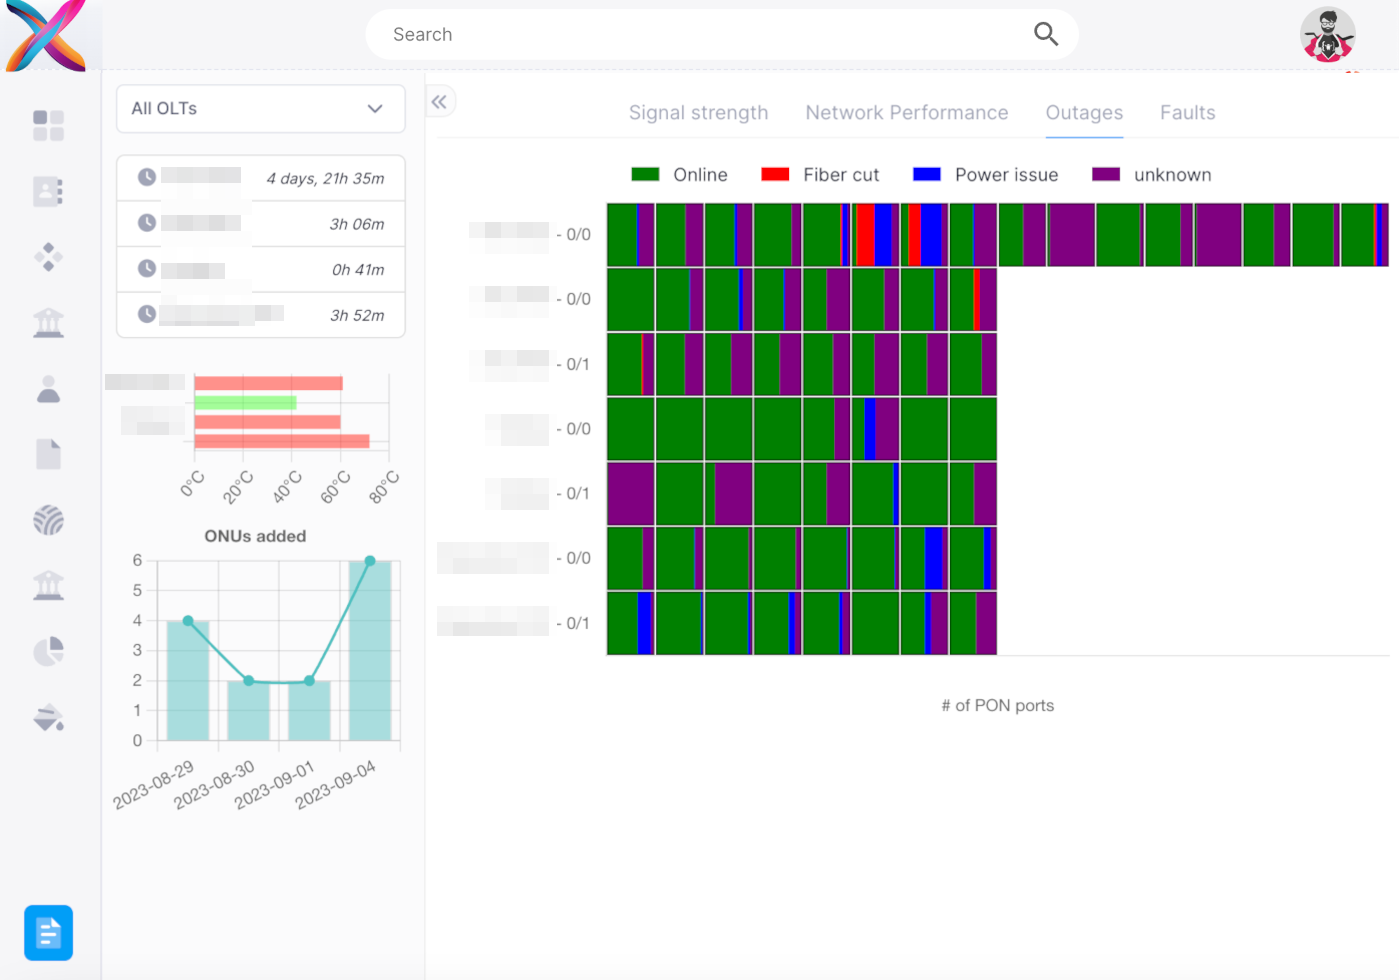
You can monitor all ONU/ONTs status on all ports of all OLTs from the dashboard. This lets you make a quick decision when things go wrong.
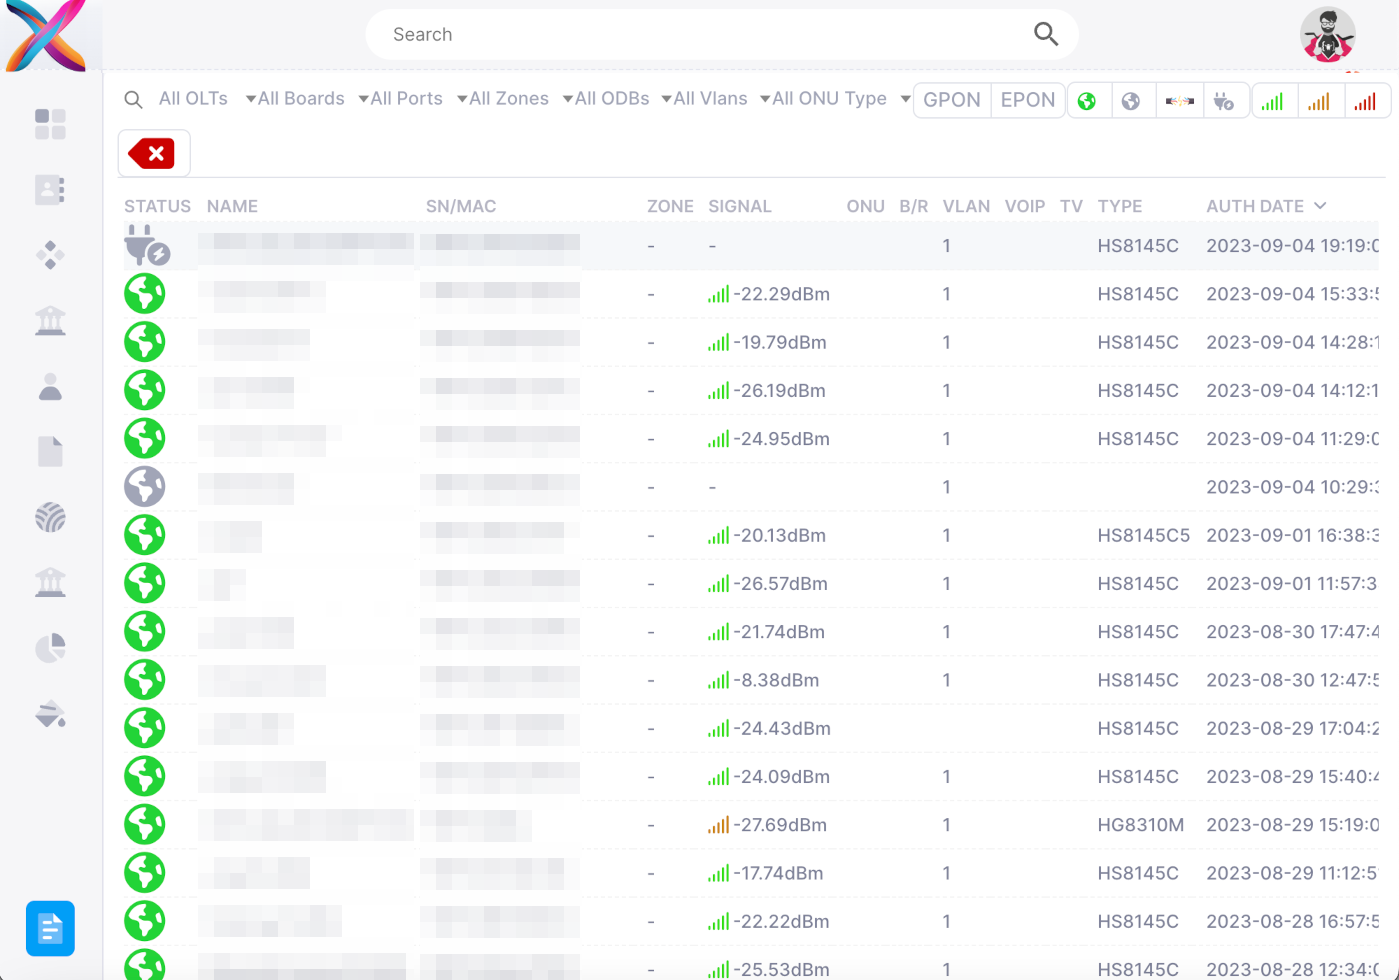
All added ONU/ONTs are listed with enough details to find the right one. These devices can be sorted by any property to do network analysis.
You can filter the list by any possible combination of tags/filters. You can use search bar and these filters to narrow down the device listing to find your required device quickly and easily.
Each row has an indicator to show the current status of the device. Also the row is colored according to the status to make it easier for you to know it.
You can monitor OLT vitals like CPU/Memory usage live along with FAN speeds, all cards temperatures, etc. You can manage all uplink and PON ports, configure and assign VLAns. In depth data of all PON ports is available as well.
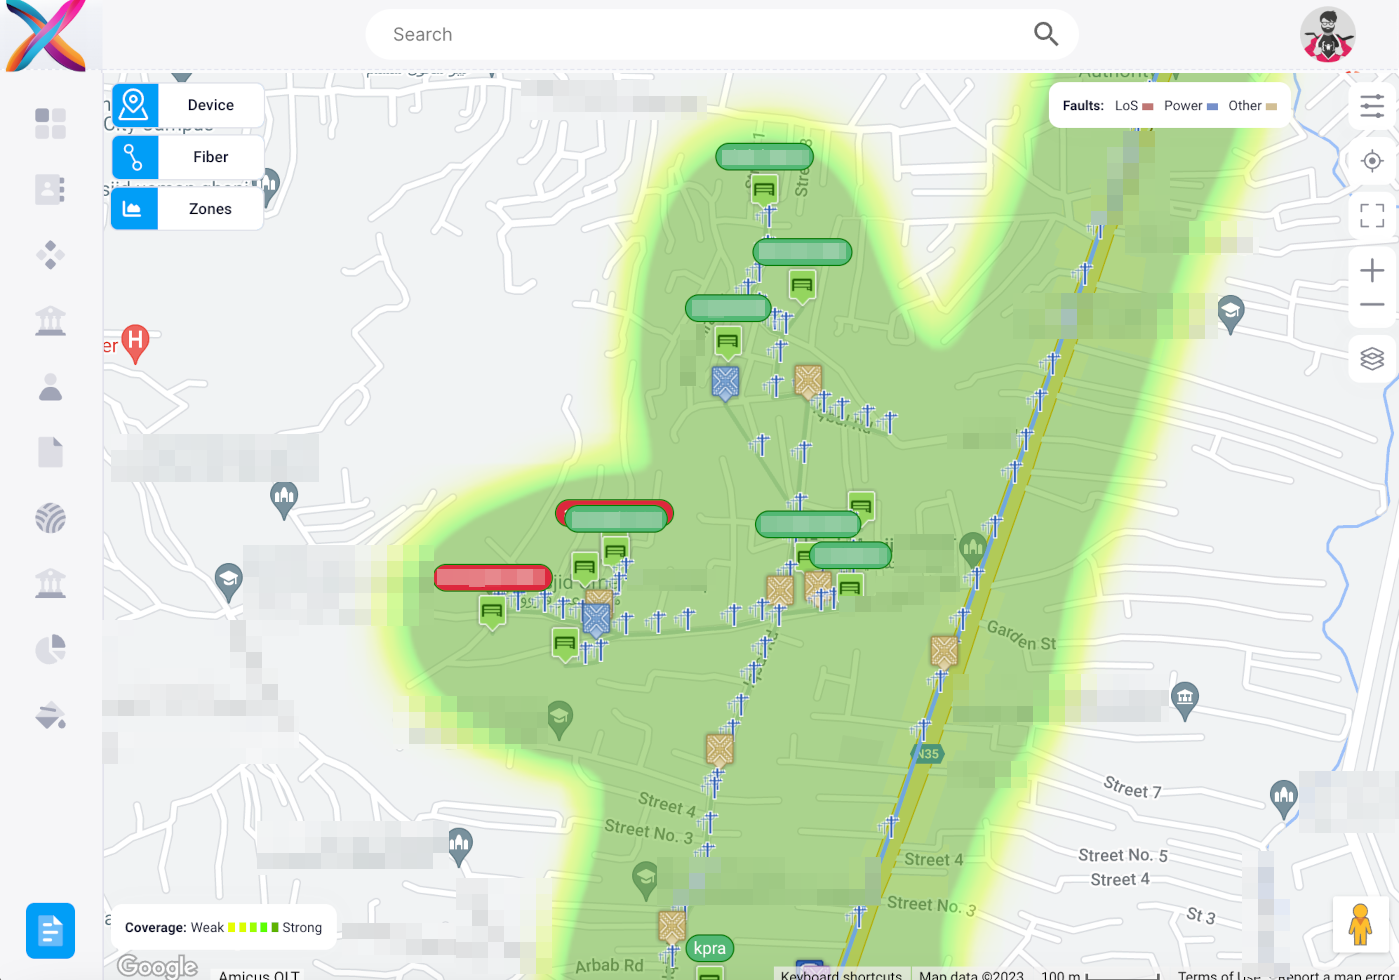
All laid infrastructure can be managed from Google Maps. This allows you to manage 2 or more core fiber deployed. You can add locations of all you DBs, spliced boxes, splitter (4 way or more).
ONU/ONTs can be linked to the anchored nodes at their geo-locations on the map. Once linked, device status and down cause is shown with different colors on the map.
Once devices are linked, you can easily monitor the health of the network on google maps as various statuses are color coded.
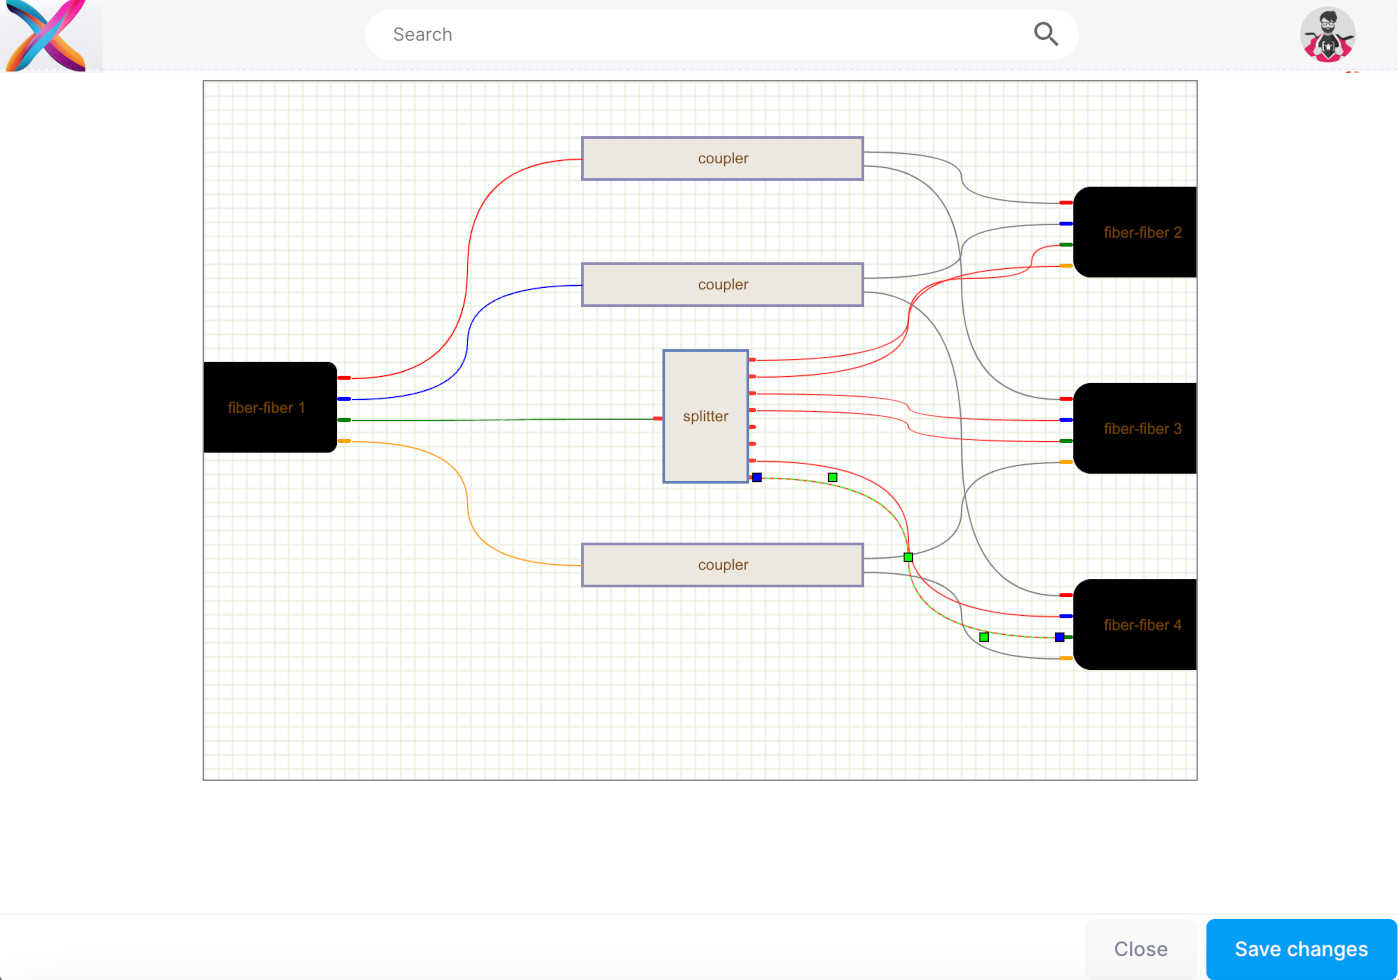
With Xelynx you can not only color code indvidual fiber core for infra-structure management but also map each core either via a splitter or a coupler. You literally have infra-structure management control to the core.
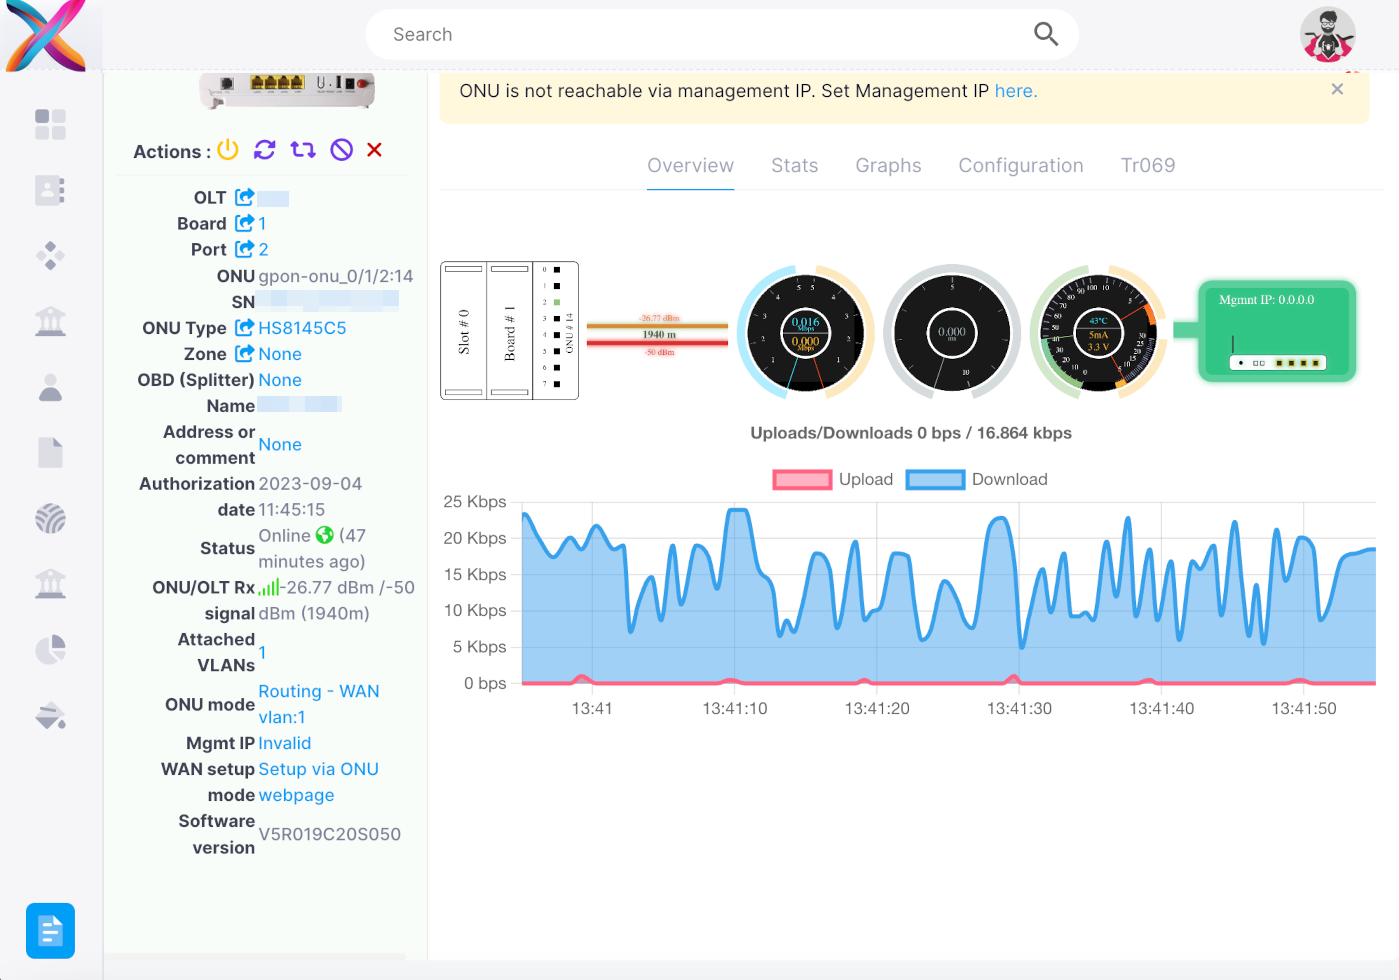
Easily add, delete, modify, manage and monitor Customer Premesis Equipment.
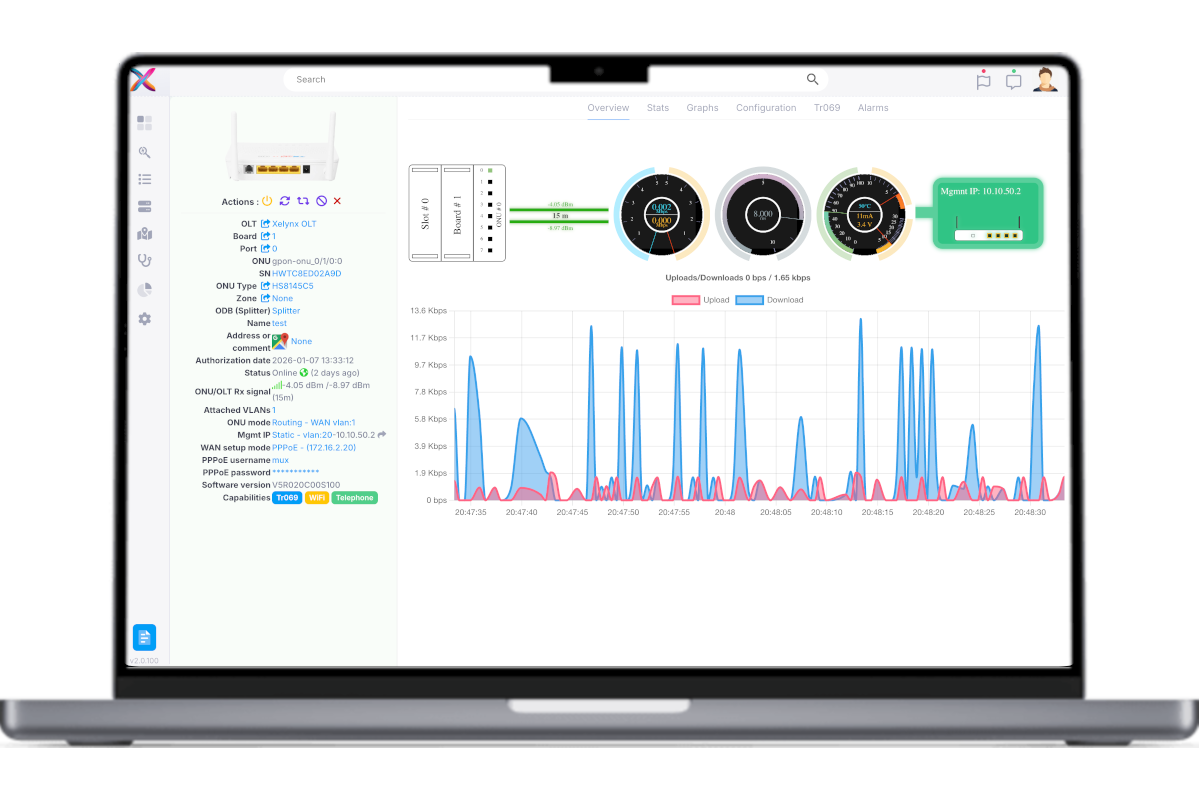
Very advanced smart widgets are designed to show information like bandwidth usage, ping latency, CPEs temperature, Voltage and Current usage. Visual representation of OLT and the port it is connected to and ONU representation with actual number of ports with their speed and connectivity status.
Xelynx has inbuilt Tr069 provision server which talks directly to CPEs.
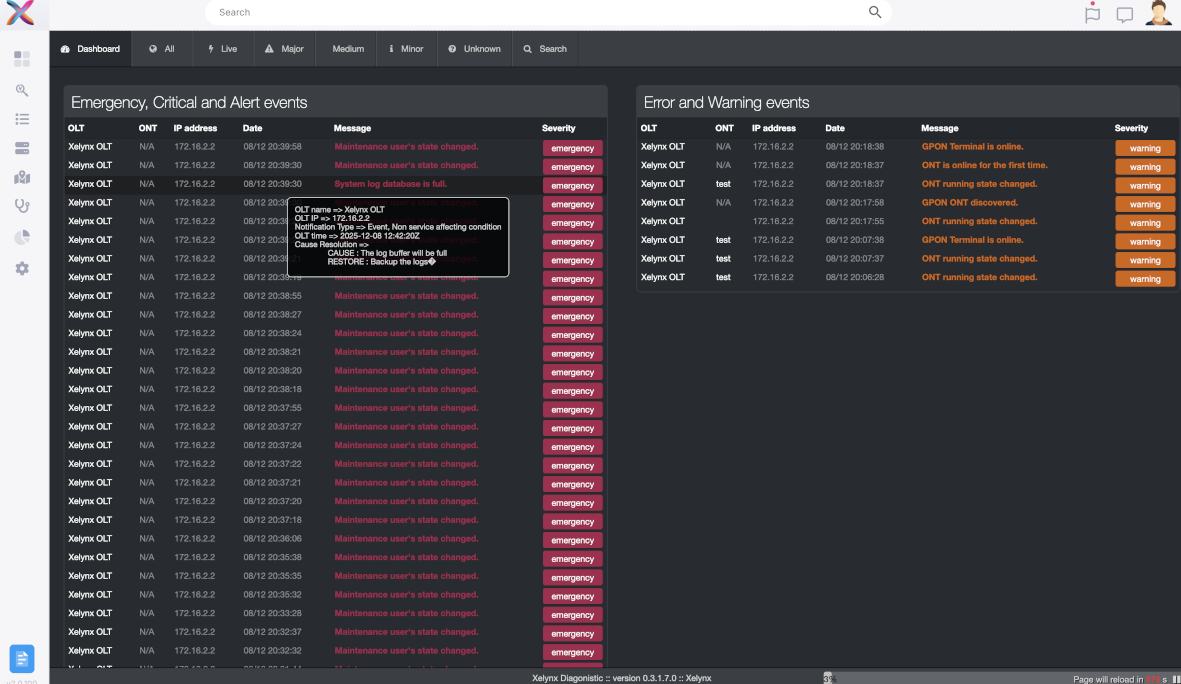
Xelynx has built-in Diagonistic system. All alarms generated by OLT or any of the ONUs/ONTs are reported here. You get all live alarms related to statuses, fiber-cuts, electricity issue, security issue (Login attempts, etc) and much more.
ONU types management
Zone Management on Maps
Distance between nodes on Maps
Coverage on Google Maps
Fault visualization
Down cause of ONU
OVPN for Management IPs
Auto-find of new ONUs
VoIP
OLT profiles
We will continuously be developing Xelynx to support more devices


Few valuables words from our customers
Pricing that works for everyone
Manage/Maintain 1 OLT
Unlimited ONUs/ONTs
Full control of OLT
Full Control of ONUs/ONTs
Infrastructure Management
Manage/Mantain Fiber network layout
Color coding of fiber cores
Complete network management via google Maps
Diagonistics with Alarms
Live notifications when something goes wrong
Here are some of the basic types of questions for our customers
There is no limitation on number of CPEs. You can add as many as you want.
No. You only need to purchase one Infrastructure management module. Once you have bought it, you will need to pay $25 for additional OLTs
Use our dedicated support email (support@xelynx.com) to send your issues or feedback. We are here to help anytime.
Yes, We will update the NMS regularly. All the future updates would be available without any cost.
Still have unanswered questions? Contact Us