Dashboard
The Xelynx dashboard provides detailed insight into your network. This guide breaks down every tab and widget shown on it.
Xelynx dashboard overview
The Xelynx dashboard provides detailed insight into your network. A breakdown of the details is given below.
Information about each item on the page is given below.
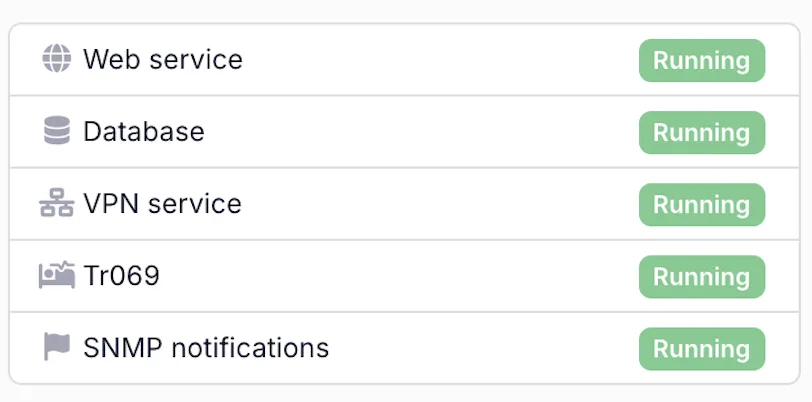
- Web server: status of the web server running on your instance of Xelynx.
- Database server: status of the database server running on your instance of Xelynx.
- VPN Server: status of the VPN server running on your instance of Xelynx.
- Tr069 server: status of the Tr069 server running on your instance of Xelynx.
- SNMP notification service: status of the SNMP notifications service running on your instance of Xelynx.
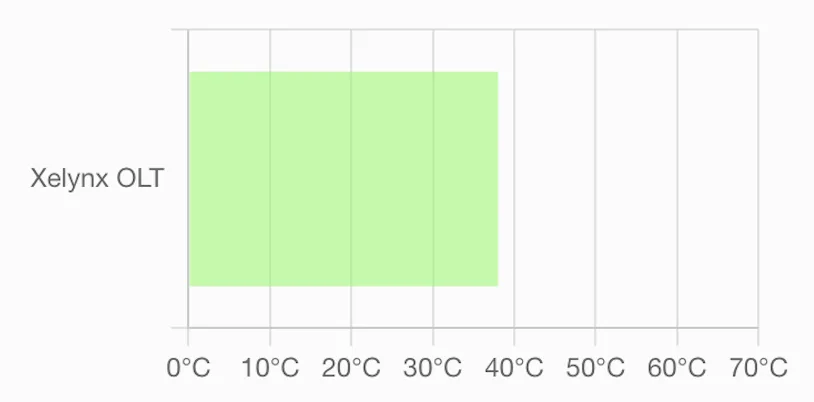
OLT Temperatures: a graph of all OLT temperatures. The colour tells the severity.
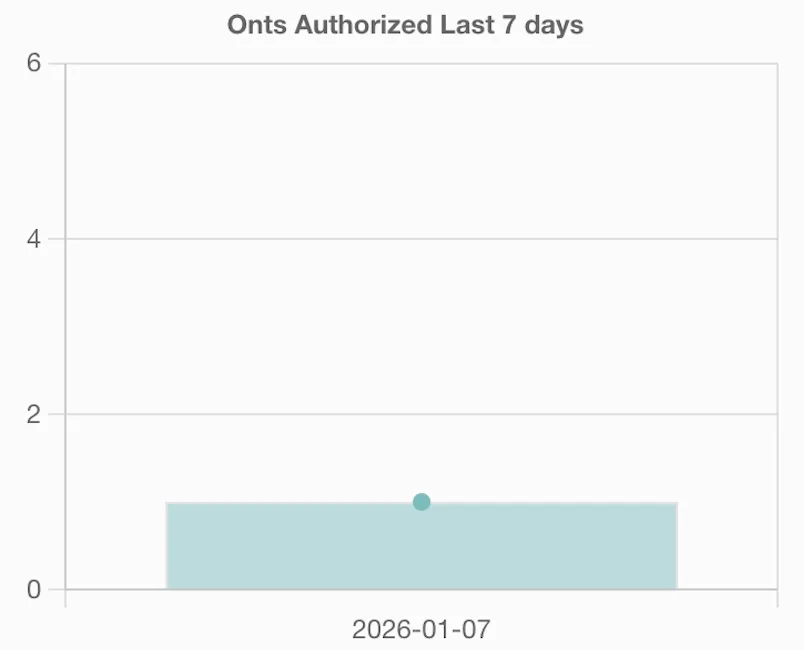
ONUs added: a graph of the number of ONUs added in the last 7 days.
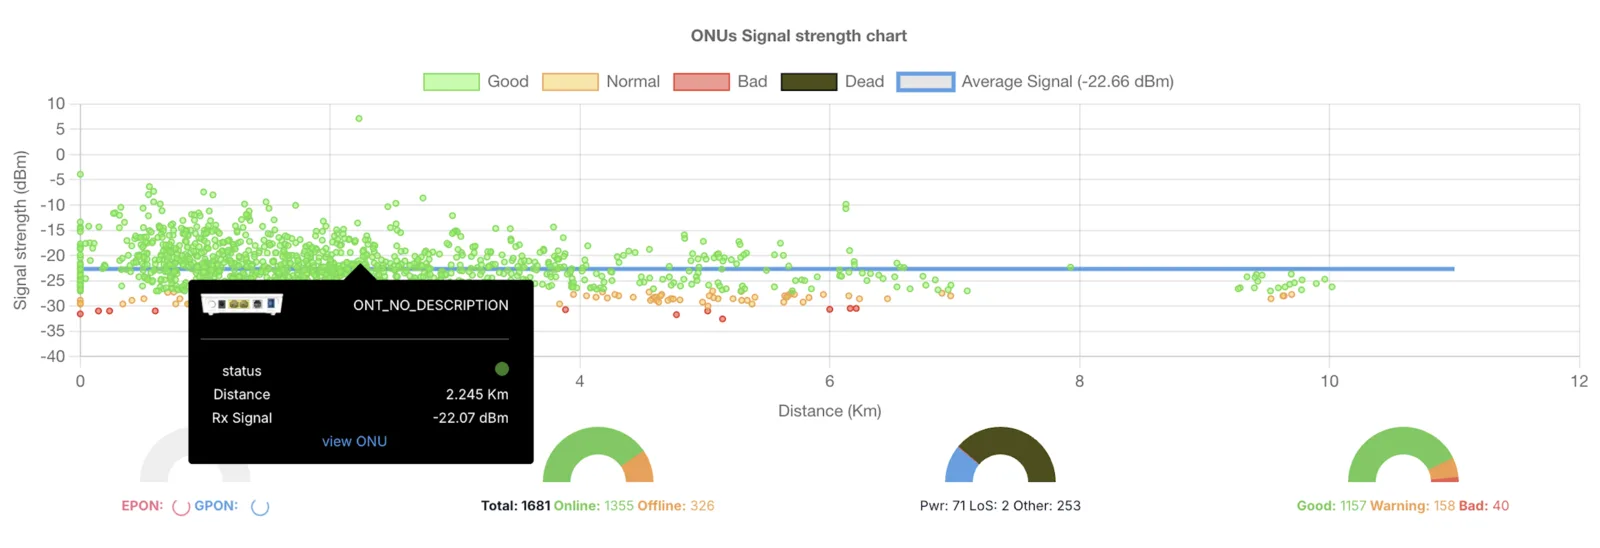
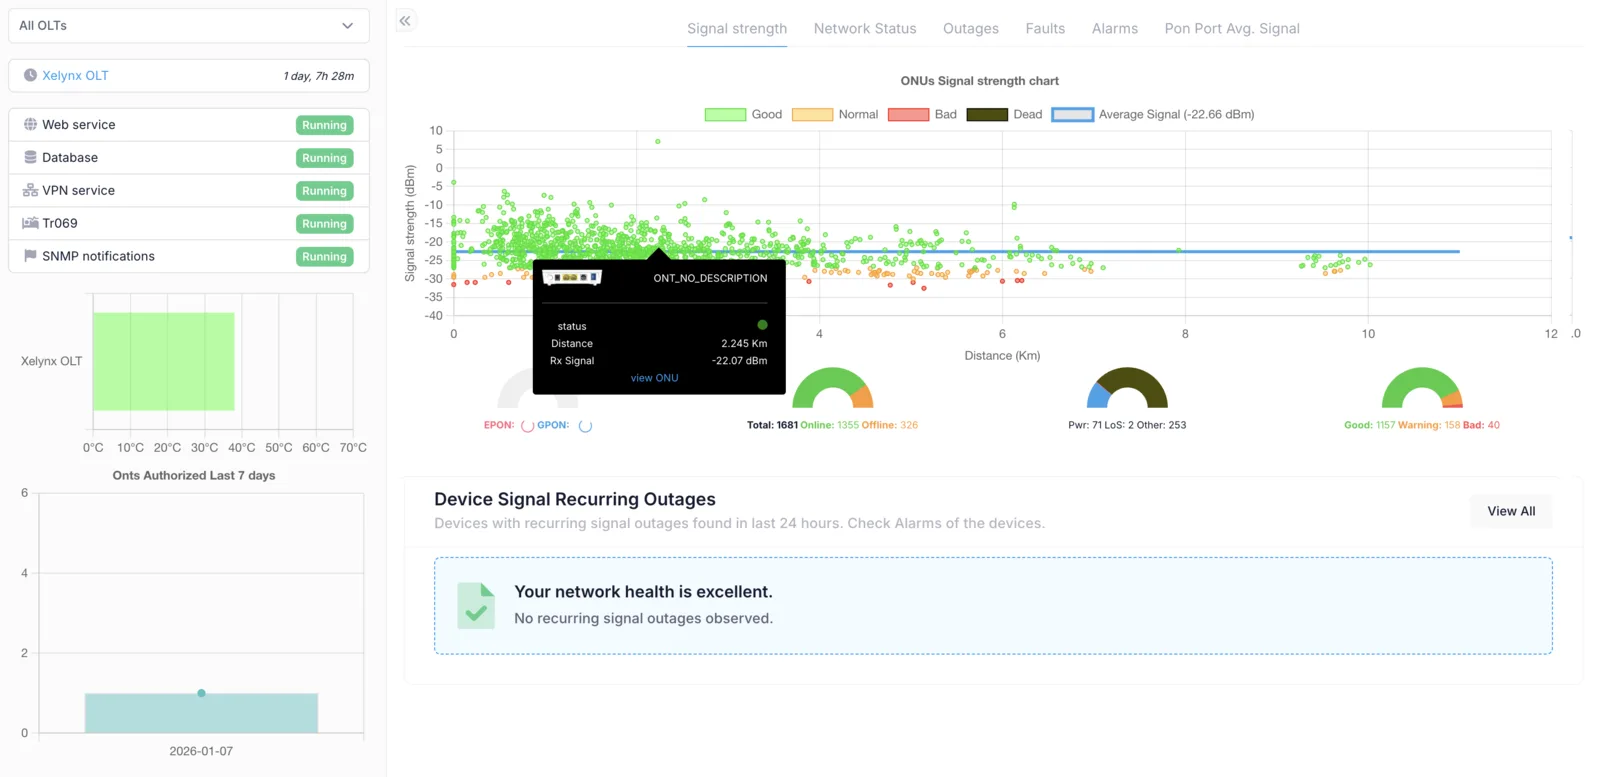
This is a very important graph, as it tells the distance of an ONU from the OLT and its signal. All points represent ONUs, with the colour telling whether the signal level is good, bad or in the warning range. Hovering on each point lets you see the details about that ONU, and you can open the ONU from here as well. There are 4 small graphs which show any unconfigured ONUs, total/online/offline ONUs, offline ONUs and reasons (LoS/fiber cut, electricity issue, other), and a graph showing the number of ONUs at good, bad or warning level. There is a horizontal blue line in the graph which shows the average signal strength of all ONUs on your network.
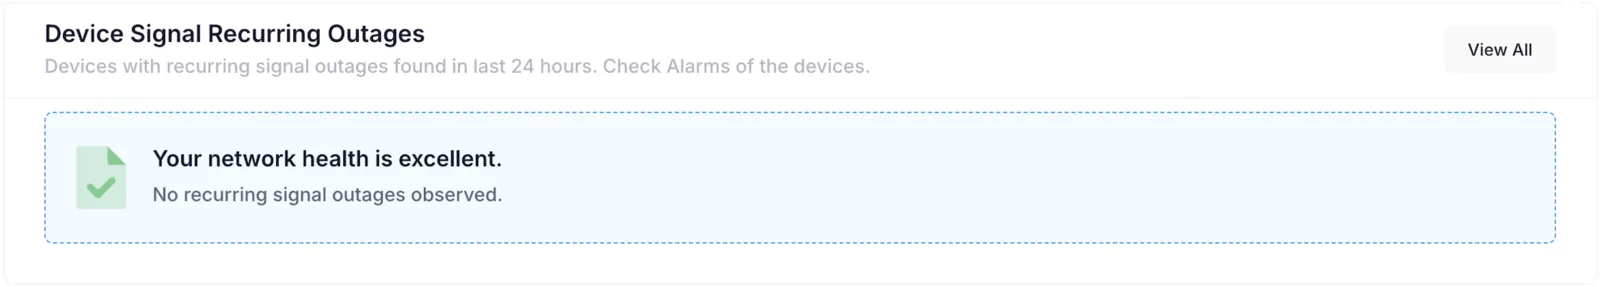
This is an AI-generated list of all the ONUs which have had issues in the last 24 hours. It is very helpful, since you can fix the issue before the customer realises it. It tells you which device went offline more than 10 times in the last 24 hours and what the reason for that was.
Network status
The Network status tab provides quick information about your network status.
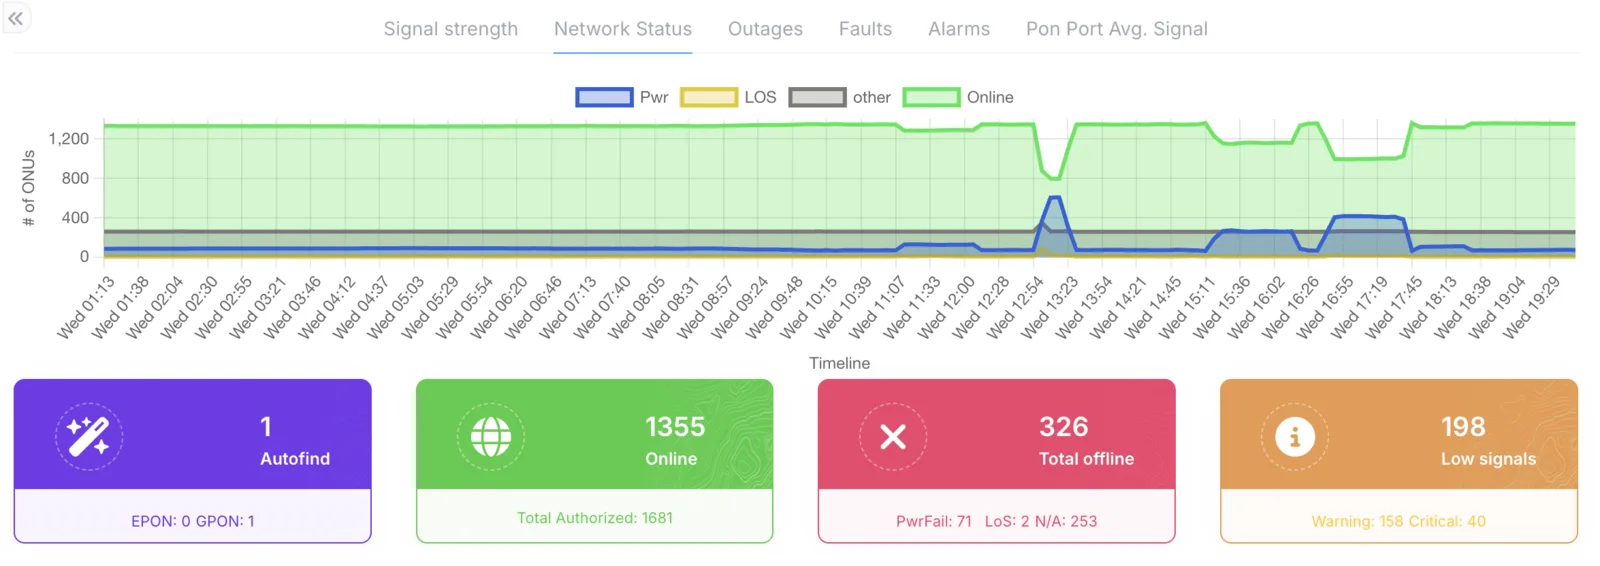
The main information displayed is the number of online ONUs and offline ONUs, with each offline ONU defined by its status.

Autofind: shows the number of unconfigured ONUs in your network.
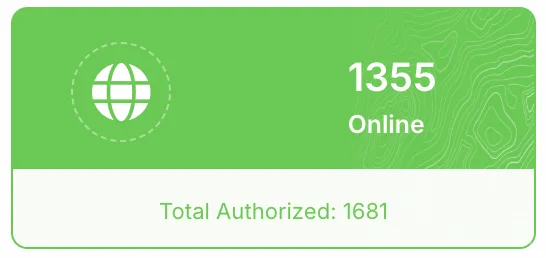
Total: shows the number of all configured ONUs and the number of online ONUs.
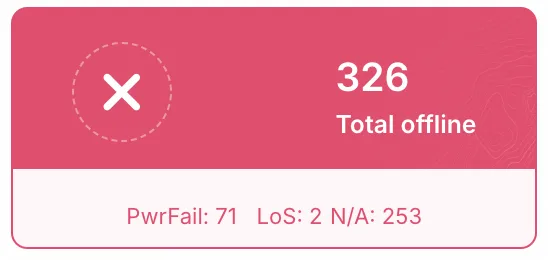
Offline ONUs: shows the number of offline ONUs in your network.
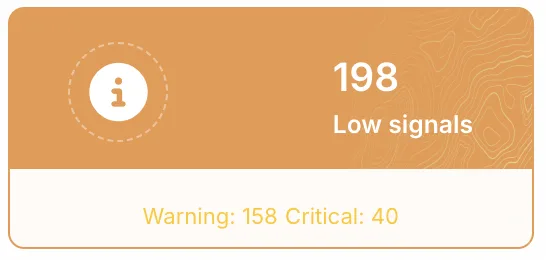
Signal level: shows the signal levels of all ONUs in your network.
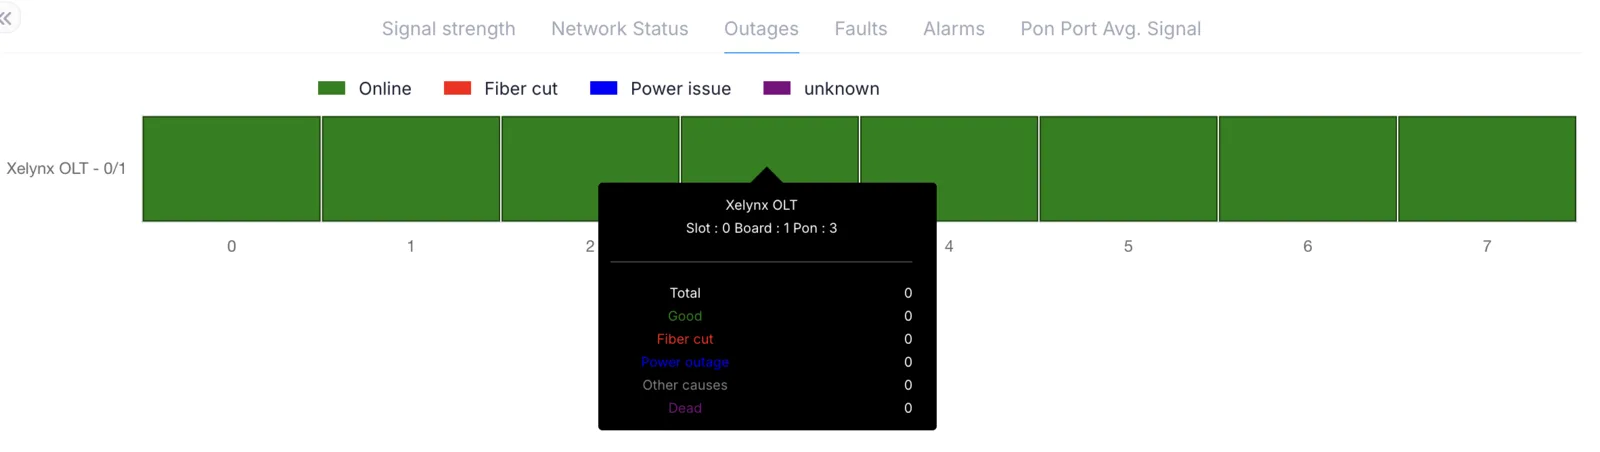
Outages
Outages on each port are shown in this graph. The percentage of online/offline devices on each port is shown.
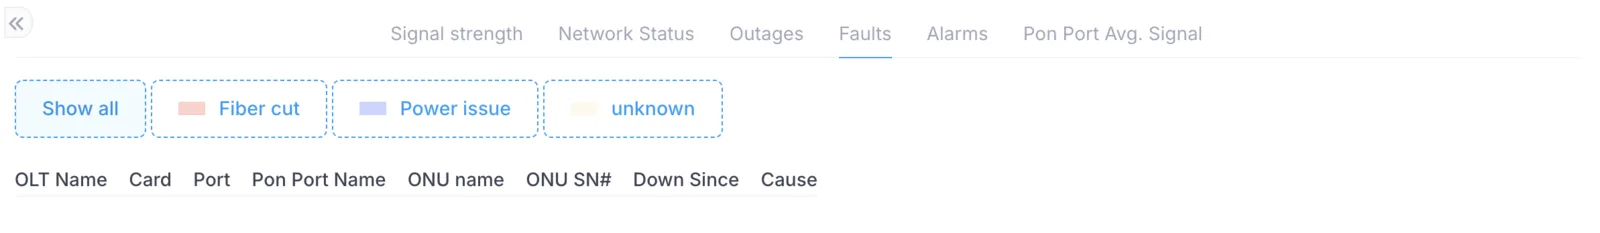
Faults
All ONUs with faults are shown here. ONUs are grouped together by PON port. ONUs and PON ports are quickly traceable from this tab.
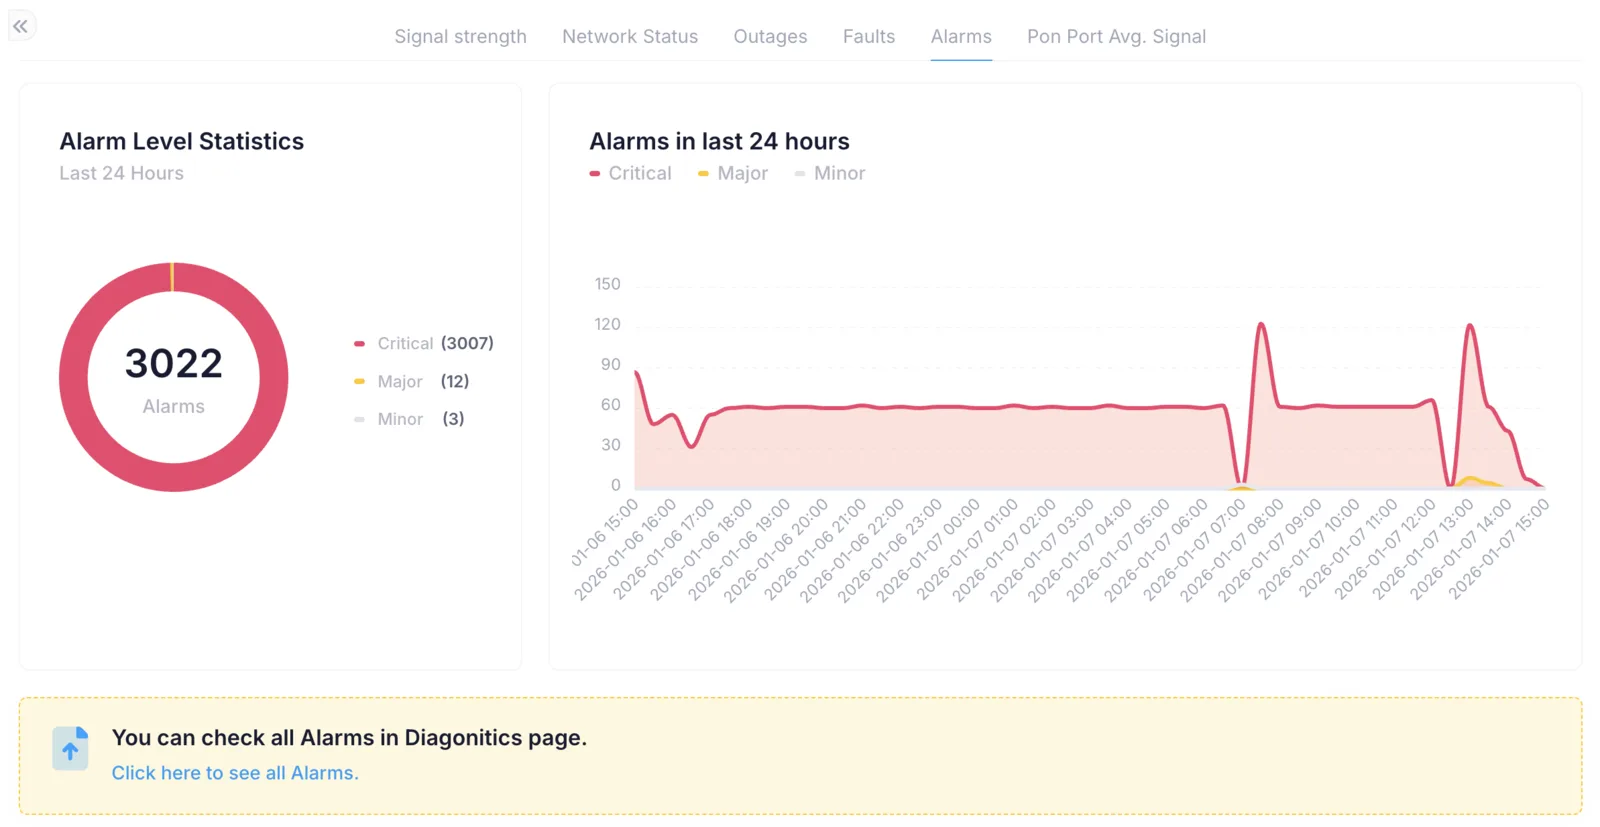
Alarms
A graph on this page shows all alarms on the OLTs with their severity level.
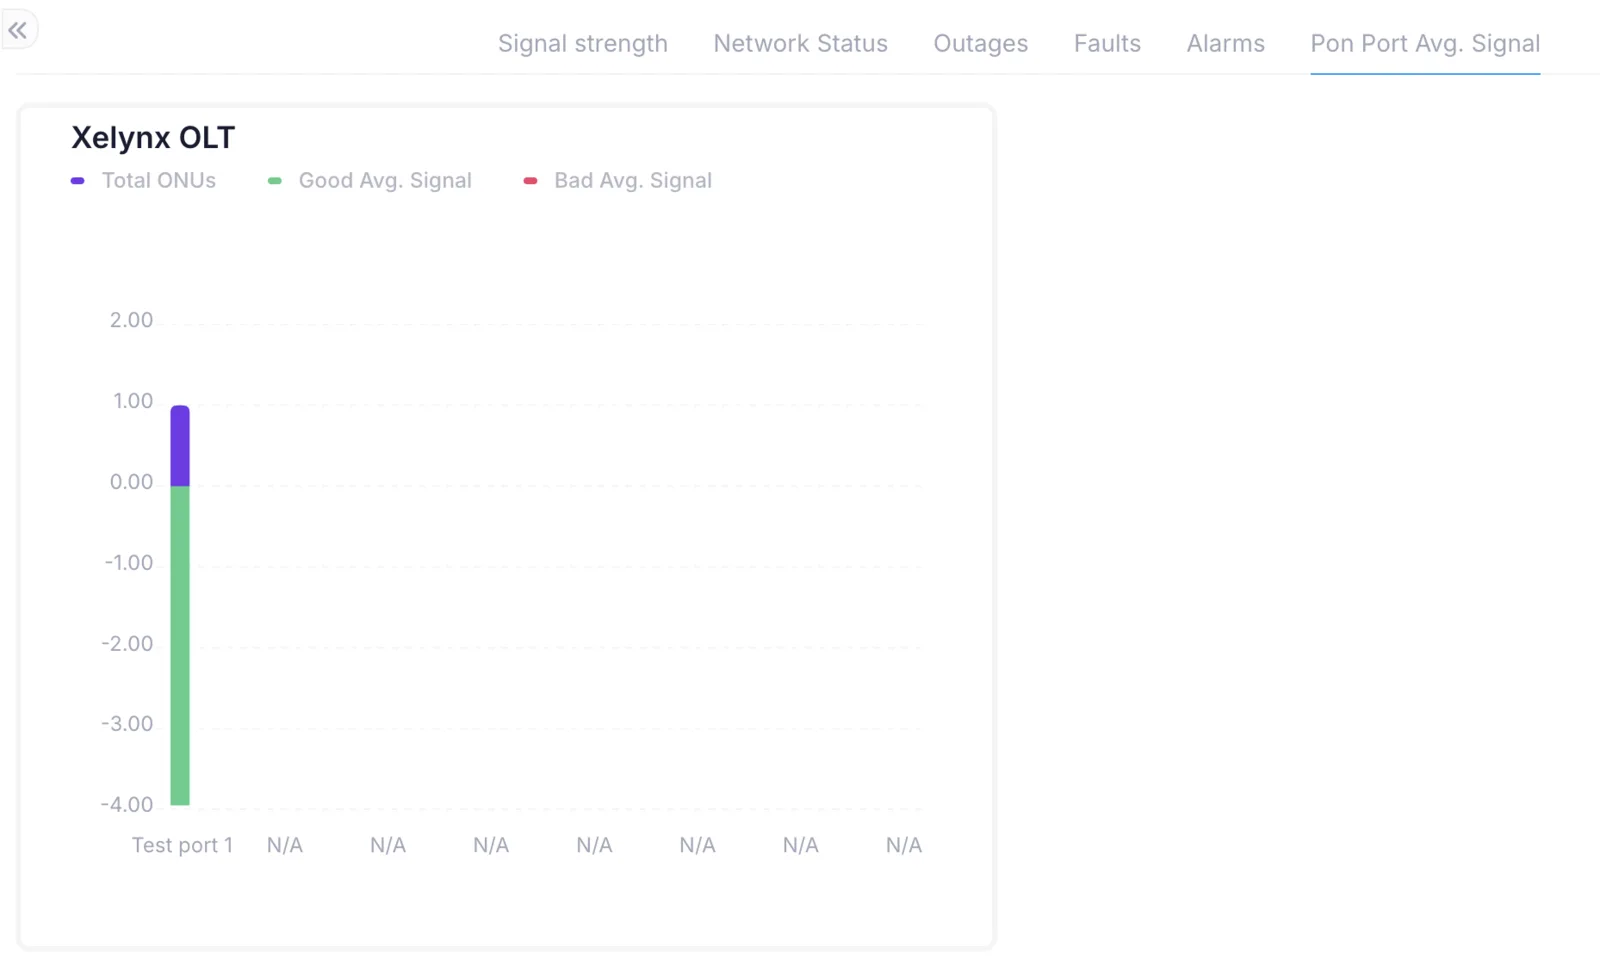
PON ports average signal
A graph showing the total number of ONUs on each PON port and the average signal on each PON port. This helps you easily find PON ports having issues and get them fixed.