OLT settings & monitoring
Xelynx makes it easy to configure your OLT — its ports, VLANs, uplink ports and IPs — and to monitor crucial details like bandwidth, power, graphs and alarms. The OLT page is organized into tabs for controlling and monitoring these settings and configurations; each tab is described below.
OLT details
On this tab Xelynx gives an overview of your OLT.
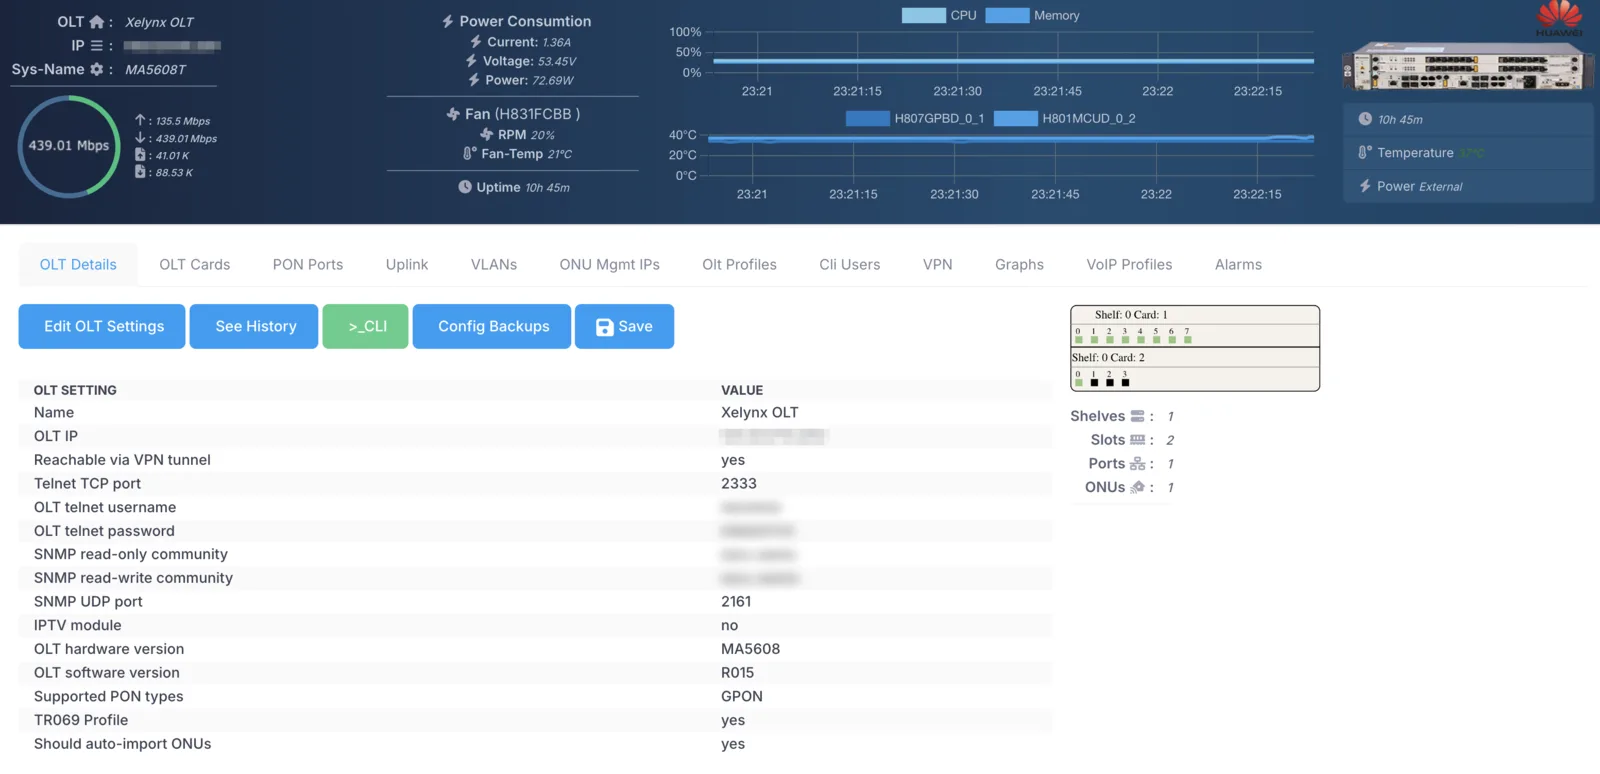
Information about each item on the page is given below.
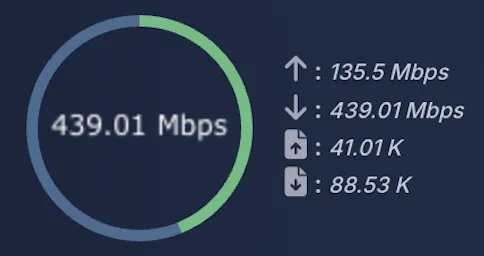
Bandwidth utilization: displays a graph of the total live download speed of the OLT. It also displays the upload speed.
Bandwidth packets: displays the live number of downloaded and uploaded packets.
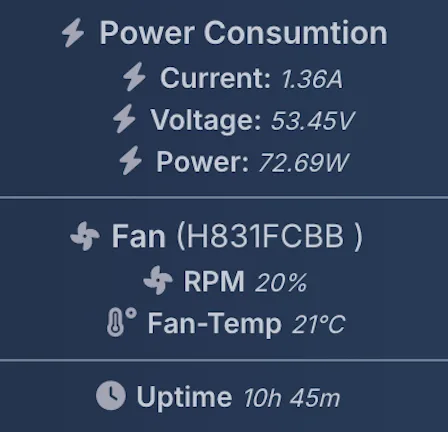
Power consumption: displays the current, voltage and power consumption of the OLT. If an external power supply is used, it displays that as well.
Fan status: displays fan stats like RPM and temperature.
Up-time: displays the up-time of the OLT.
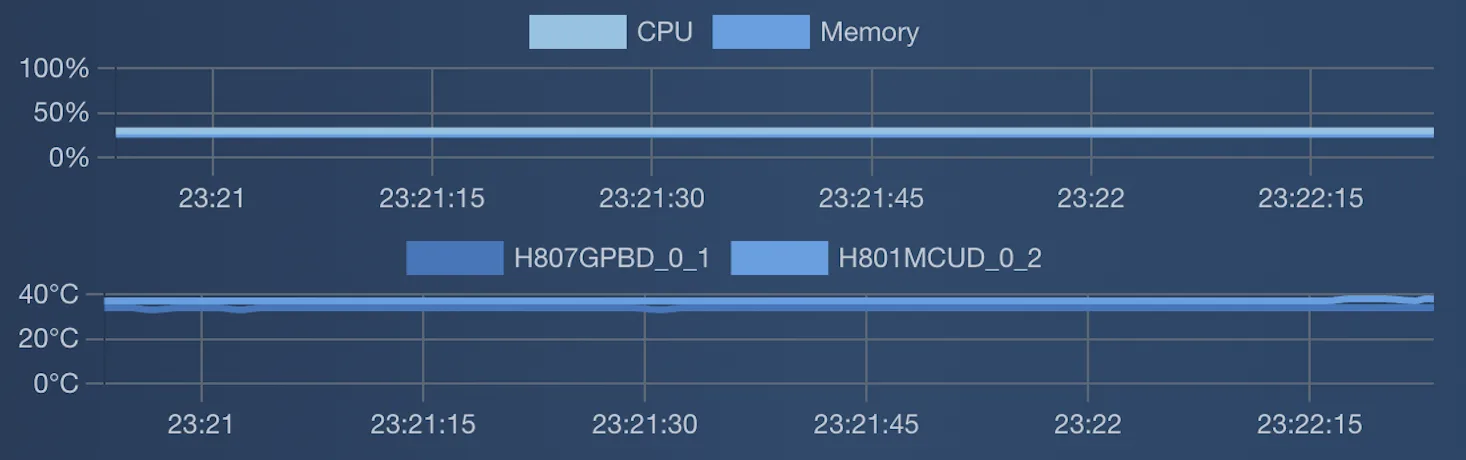
CPU consumption: displays the CPU consumption of the OLT.
Memory consumption: displays the memory consumption of the OLT.
Card temperature: displays the temperature of the cards on the OLT.
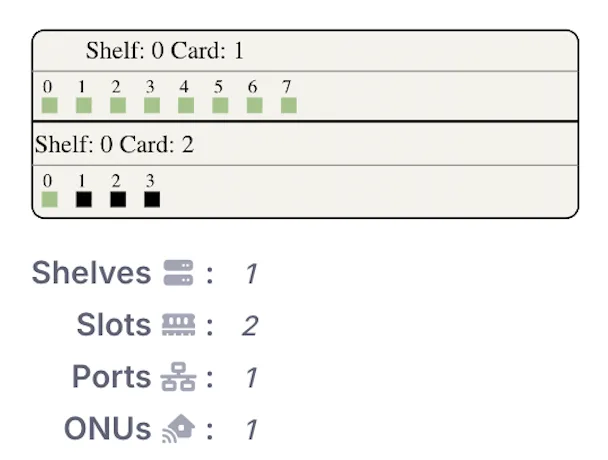
PON ports: displays the number of PON ports in each card and their status.
Uplink ports: displays the number of uplink ports and their status.
Other: displays the total shelves, slots, ports and ONUs on the OLT.
In addition to the above, you can open a telnet session to the OLT from here. You can also create backups of the configuration on the OLT and do a manual save.
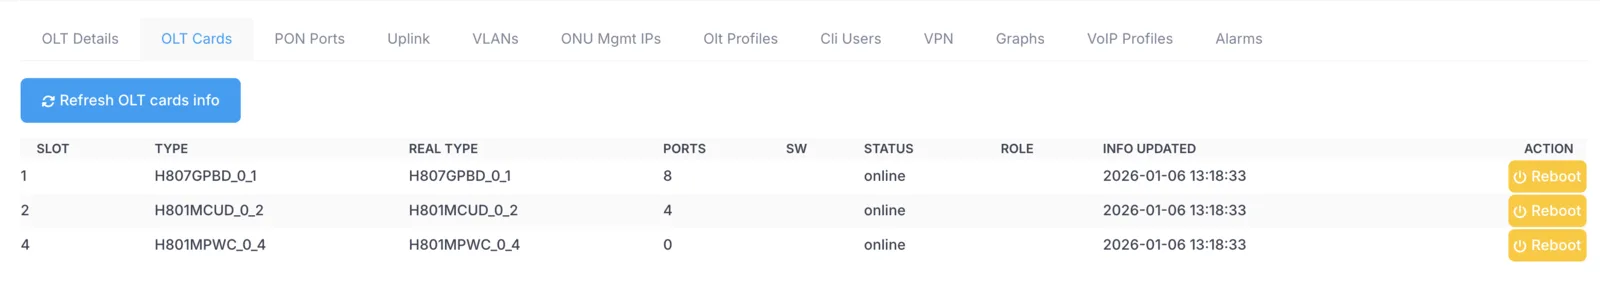
OLT cards
On this tab Xelynx gives a list of all cards on your OLT, with details about their status, model and number of ports, if any. You can also reboot cards from here.
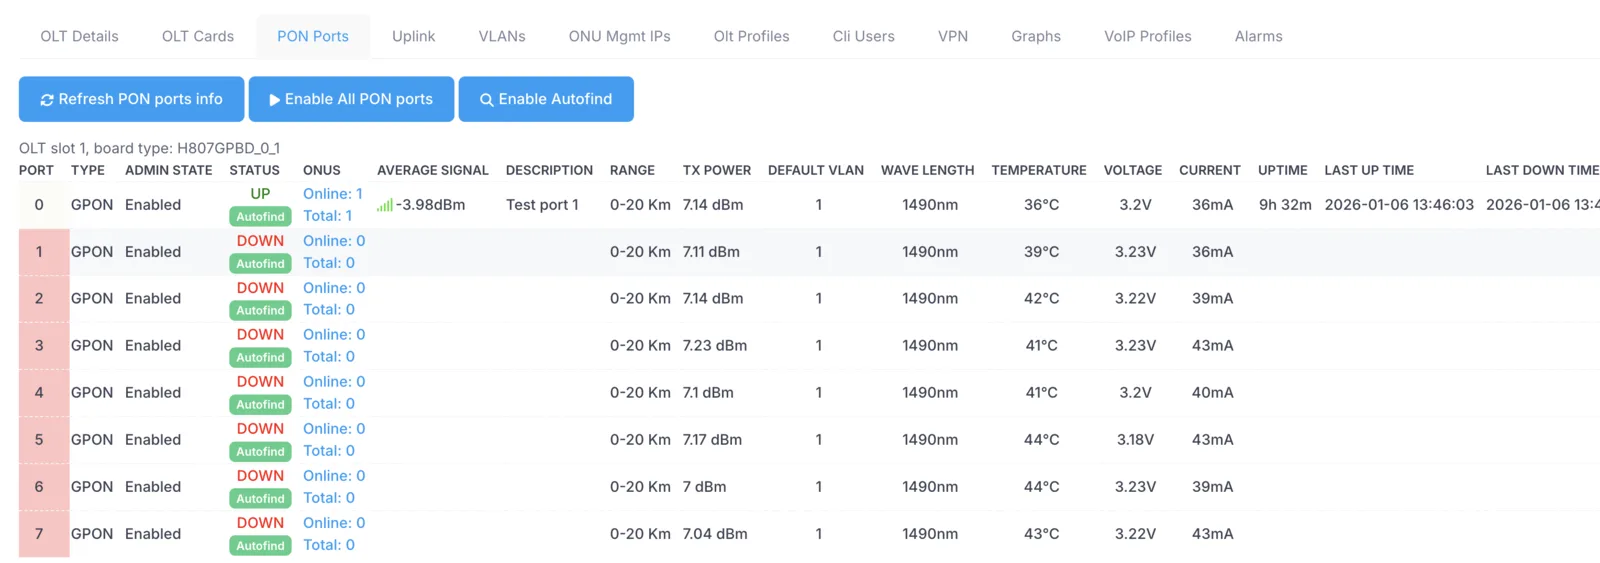
PON ports
On this tab Xelynx gives a list of all PON ports on your OLT, with every single detail about each port (27 different fields). You can also enable autofind on PON ports from here.
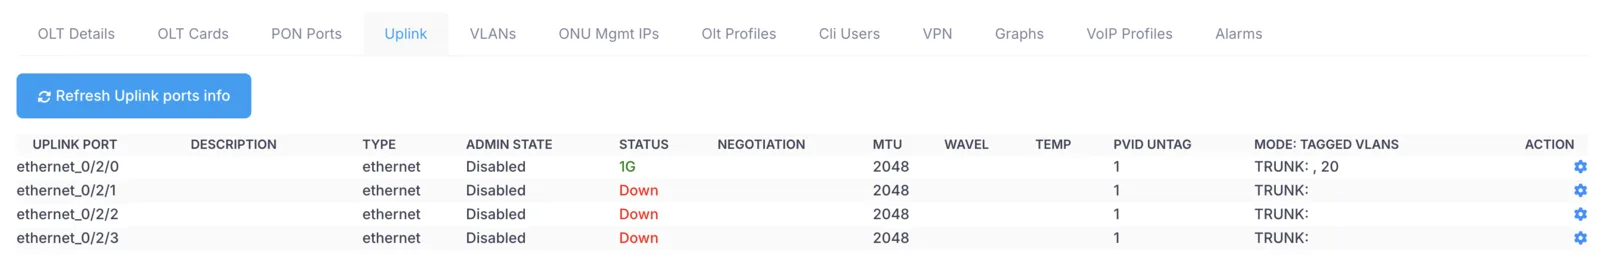
Uplink ports
On this tab Xelynx gives a list of all uplink ports on your OLT. You can tag and un-tag VLANs on uplink ports from here.
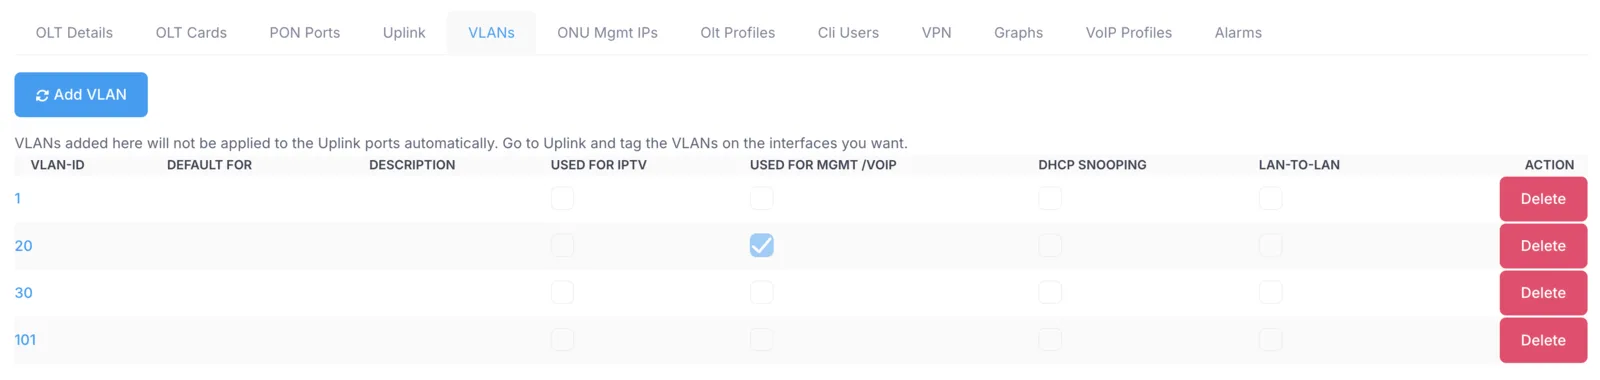
VLANs
On this tab you can add and modify VLANs.
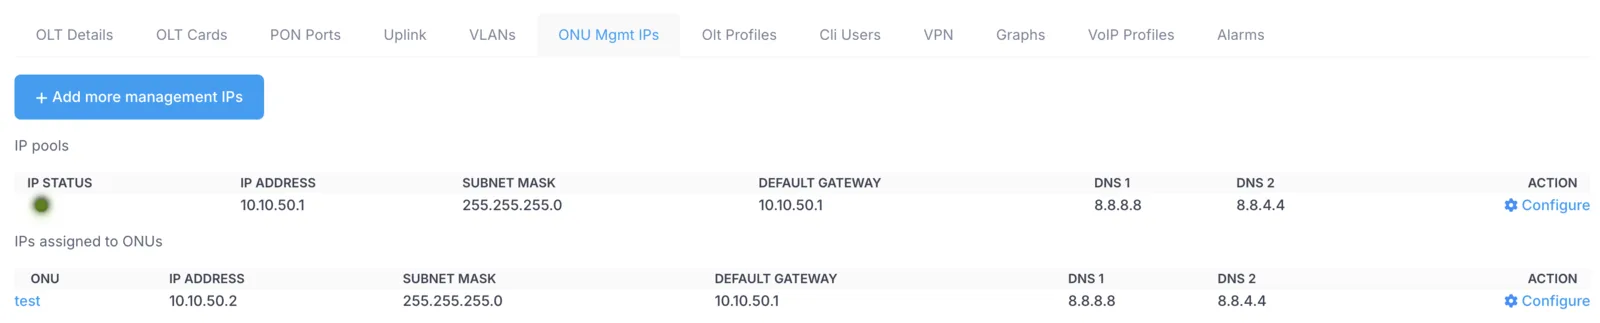
ONU management IPs
On this tab you can add and modify the IP pools used for management of ONU devices. It shows you whether the IP pools are reachable, and lists all ONUs with their corresponding management IPs.
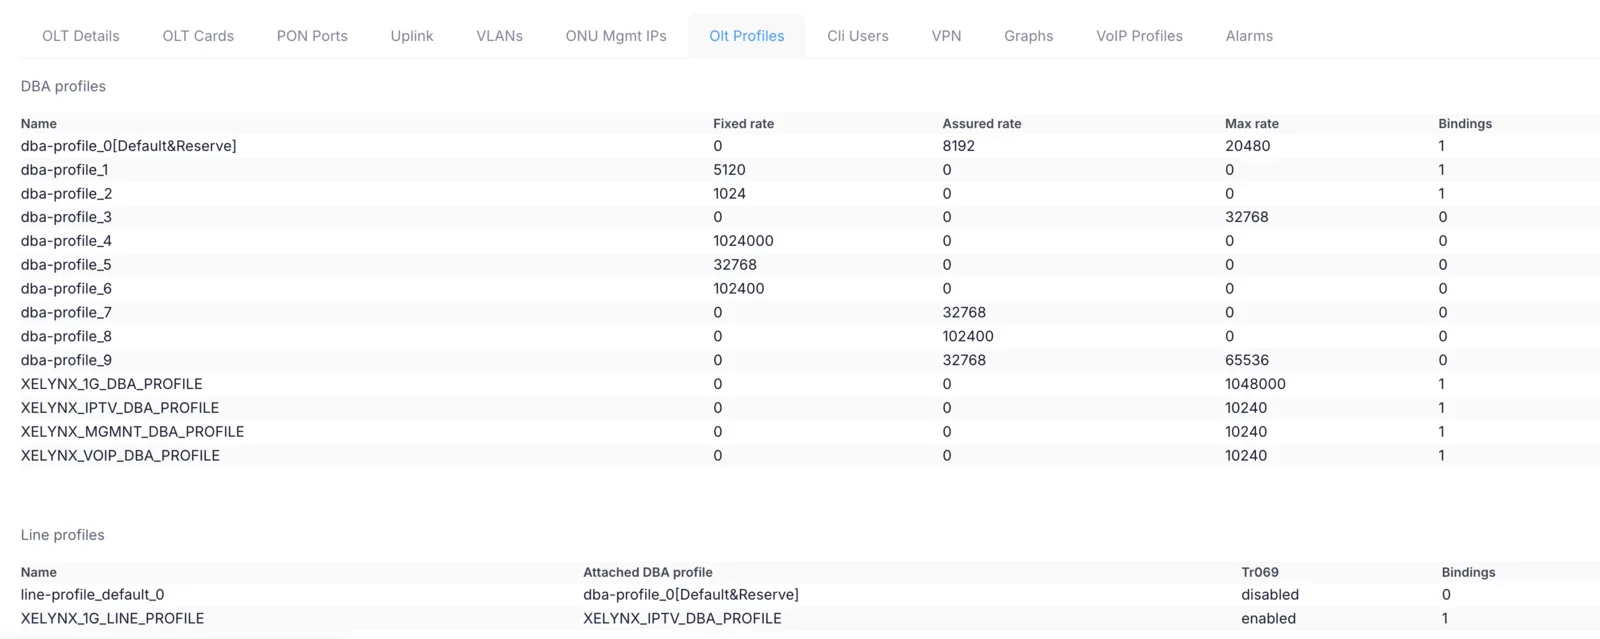
OLT profiles
On this tab Xelynx lists all profiles, i.e. DBA profiles, line profiles, service profiles and speed profiles (traffic tables).
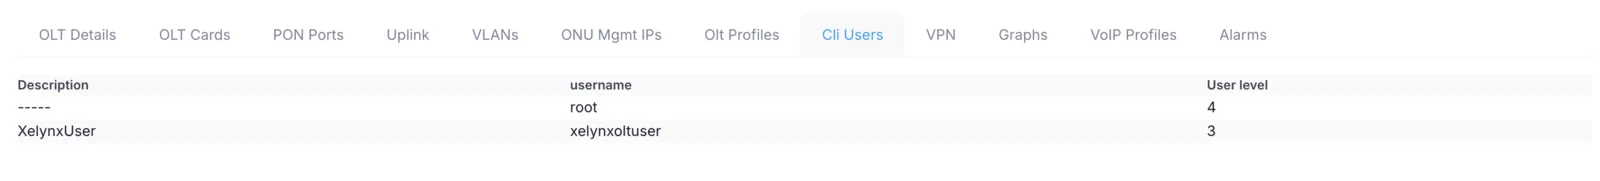
CLI users
On this tab Xelynx lists all CLI users on the OLT and their level.
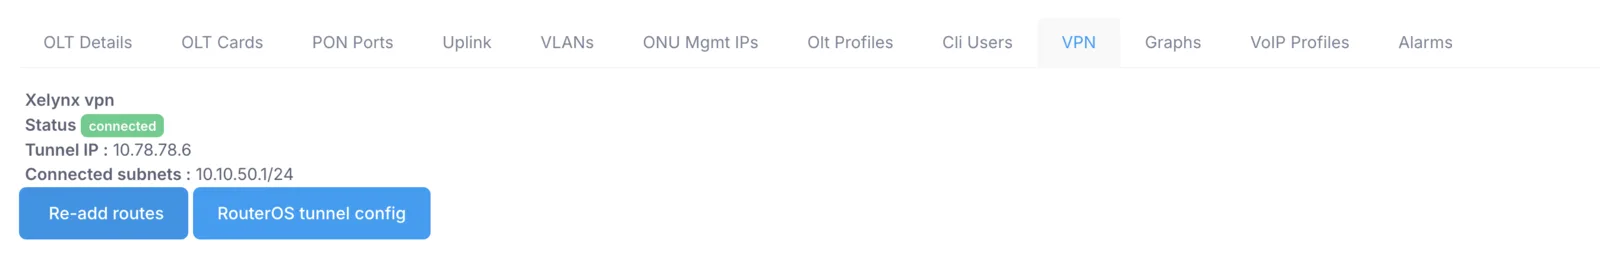
VPN
This tab displays the VPN status and all the pools routed on this VPN (all management pools). It also gives you the script to re-add the VPN client on a MikroTik router. You can also re-add routes on the server in case routes are not being routed on the Xelynx server.
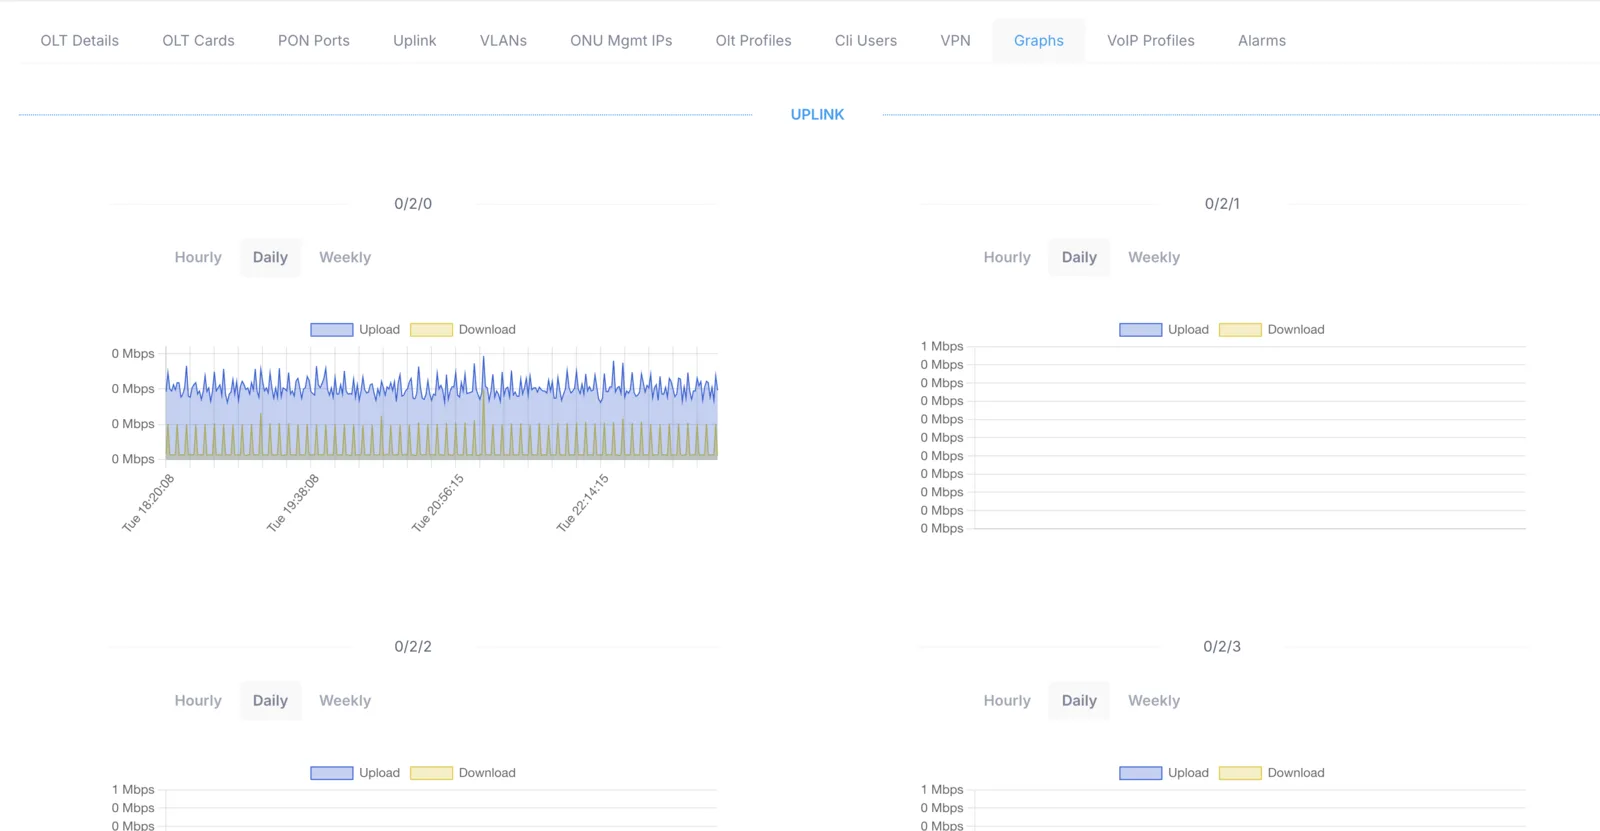
Graphs
This tab displays bandwidth-utilization graphs of all uplink and PON ports. You can view them at an hourly, daily or weekly level.
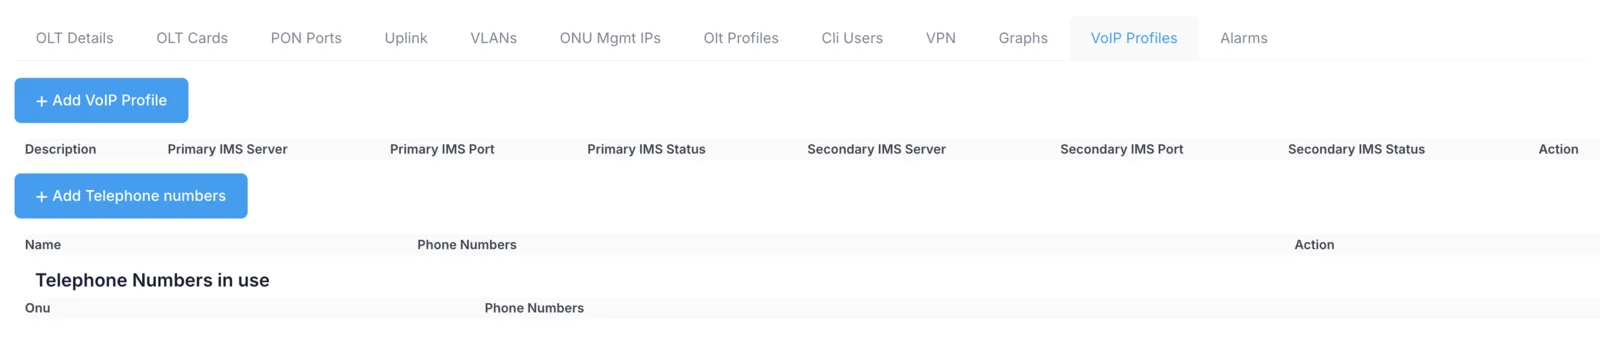
VoIP profiles
You can add, modify and delete VoIP profiles from here. You can assign a numbering pool which can be used on ONUs.
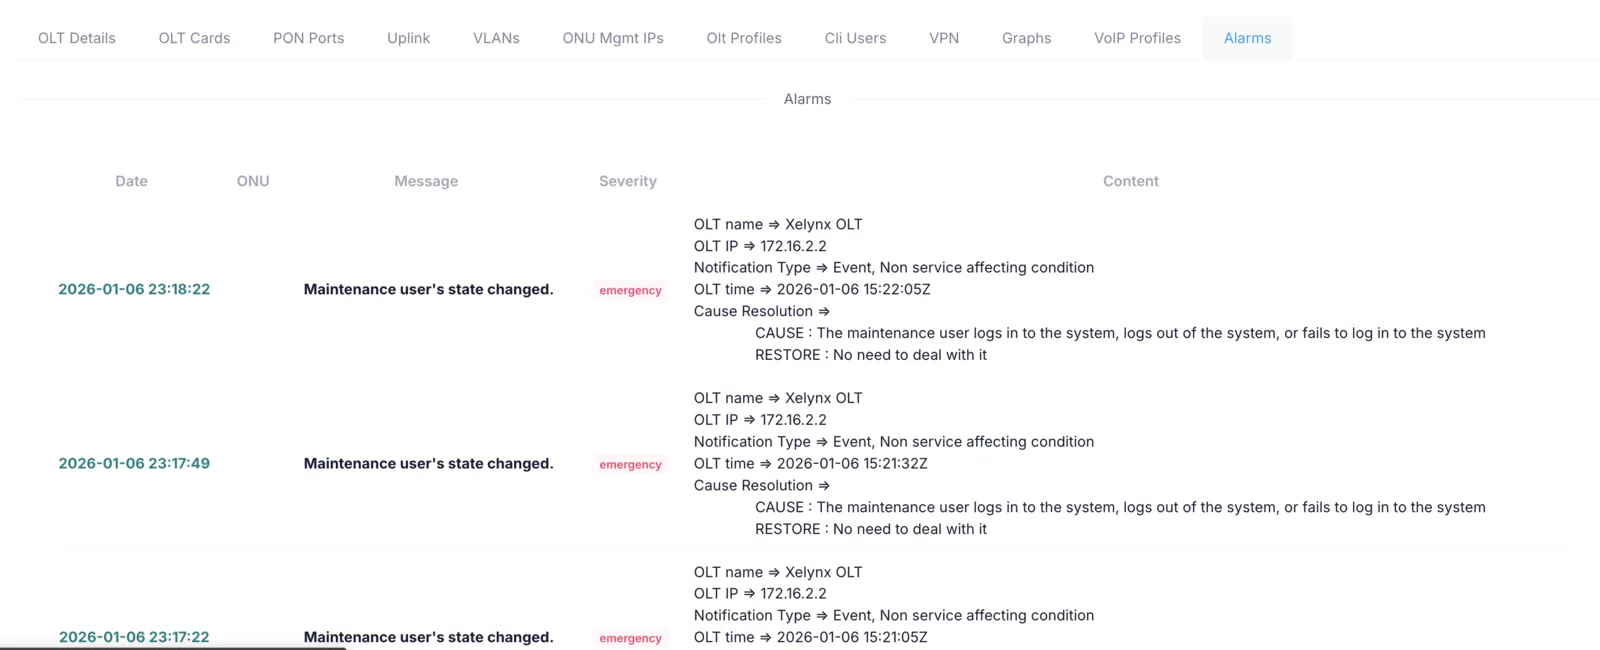
Alarms
This tab displays all the alarms generated on the OLT. It shows the alarm level, description and detail of each alarm.